- I - Nanu
- He - Avanu
- She - Avalu
- You - NeenuIt - Adu
- This - Idu
- That - Adu
- A - Ondhu
- Mother - Amma/ Thaayi
- Father - Appa/ thandhe
- Come (You come) - Baa
- Came - Baandha (male)/ bandhalu (female)
- Will come - Baaruthare
- Open - Bhichu
- Opened - Bhichidhe
- Will open - Bhichabeku
- Sit - Kuthko/ kulithuko
- Walk - Nadee
- Eat - Thinnu
- Drink - Kudee
- Win - Gellu
- Go - Hogu/ horadu
- Run - Odu
- He is eating an apple - Avanu sebu thinnuthidhane
- He ate an apple - Avanu sebu thindhanu
- I saw the film last week - Nanu hodha wara picture/ chalanachitra nodidhanu
- She came by bus yesterday - Avalu ninne businalli bandhalu
- They went to the mosque - Avaru darga ge hodharu
- He slept the whole night - Avanu eedi raatri malaghidhanu
- He wrote well in the examination - Avanu pariksheyalli chennaghi baredhanu
- He has eaten - Avanu thindhidhane
- He will eat - Avanu thinnuthane
- He will go - Avanu hoguthane
- He will come - Avanu baruthane
- What is your name? - Ninna hesarenu?/ Ninna hesaru yenu?
- What - Yenu?
- Your - Ninna
- Name - Hesaru
- What did you do? - Neenu yenu maduthiya?
- What should I do? - Nanu yenu madabeku?
- What can I do? - Nanu yenu madabhahudhu?/ Nanu yenu madaballe
- What are the questions? - Yenu prashnegalu?
- What were the questions? - Yenu prashnegaliddhavu?
- What is the last question? - Koneya prashne yenu?
- What is written in the letter? - Pattradhalli/ kaagadhadalli yenu baredhidhe?
- What you had been told? - Ninege yenu helabekithu?
- I don’t Know Kannada - Kannada Baralla/Gottila
- Where - Yelli/Yellige
- Give it - Kodu/Kodi
- Who - Yaaru
- What - Yen/Yenu
- What is Guru? - Yen Guru Yen Samachar?
- What’s up? - Utta ita?
- How are you? - Hegiddera?
- Well done - Channagiddini
- Aptitude - Jaasti
- I will pay by the meter - Naanu meter rate kodthini
- Not going - Hoggala
- What is your name? - Ninna hesarenu?
- Have a good day - Shubha Dinavāgali
- Hello - Namaskara
- I know - Baruthe
- me - Naanu/num
- you - Ninu/Nim/Ni
- no - Illa
- work - Kelsa
- come - Banni/Baraa/Barappa
- Go on - Hogu/Horadu
- The lady - Nalle
- How much? - Yeshtu
- Do you speak english? - Eevu Inglish Mathanadutthira
Sunday, 2 July 2023
Basic Kannada
Monday, 29 August 2022
Core Web Vitals
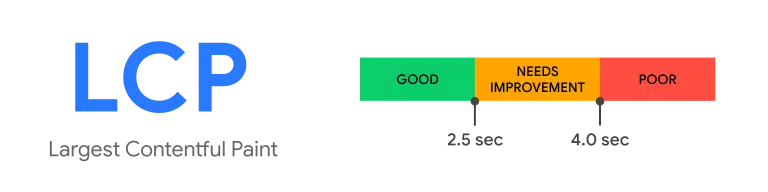
What is Largest Contentful Paint (LCP)?
Largest Contentful Paint is the metric that measures the time a website takes to show the user the largest content on the screen, complete and ready for interaction.

Google defines that this metric considers only the content above the page’s fold, meaning everything that appears without scrolling.
There is another relevant point, which is related to the type of content considered. The metric only counts the loading time of what is relevant to the user experience, that is:
- Images.
- Image tags.
- Video thumbnails.
- Background images with CSS.
- Text elements, such as paragraphs, headings, and lists.
How to measure it?
You can measure LCP in two ways:
- Directly on the site, by using a method known as “field”.
- Through performance simulations performed by algorithms, in this case, the lab mode.
For each of these methods, different tools speed up the work and make the measurement more accurate. Starting with the field method, you could use:
- Chrome User Experience Report;
- PageSpeed Insights;
- Search Console (Core Web Vitals report).
As for the lab tools, the most recommended are:
- Chrome DevTools.
- Lighthouse.
- WebPageTest.
What is a good score?
Since metric monitoring is essential, it is also necessary to understand the minimum performance standards expected.
There’s a specific demand from Google’s algorithms regarding page loading time, considering the main content. In this case, we are talking about up to 2.5 seconds, which is a good result.
How to optimize it?
- Optimize image sizes
Always use images with the right sizing. Your hosting will suggest specific dimensions, either for the desktop or mobile version. Using the indicated size avoids overloading, which can generate a high LCP. Use Webp format images.
- Use an image CDN
A CDN service can make images load faster. ImageEngine is a tool that does all the work of image adequacy, considering factors such as accessing device, file size, and user location.
- Avoid JavaScript to load images
JavaScript loading can slow down the process, so the best thing to do is to leave this work to your browser. That helps to prevent any delay, keeping the LCP within the recommended average.
- Choose a good hosting service
Your hosting service also impacts pages’ loading time. Therefore, find a quality one that has a good reputation in the market, and, mainly, that offers an adequate infrastructure for your site’s size and volume of access.
- Minify HTML, CSS & JavaScript
Reduces the file size by removing the space in code
- Enable caching
- Use system font
If using special fonts then use code: font-display: swap; in CSS so that initialy it will load system font and then when the fancy font is loaded from server then it will show that.
- Keep DOM small
Excessive DOM size happens when there are too many DOM nodes (or HTML tags) on your page or when they are nested too deep.
- Don't keep JavaScript at top or use defer attribute with JavaScript
Async allows parallel download but files get executed immediately after download. Defer allows parallel download and files get executed after HTML is done parsing. So, Defer is better than Async
- Get the devices list from Google Analytics and test according to real device that user are using.
Ref Video:
What is First Input Delay (FID)?
FID is the time your website takes to start working on first touch/click
First Input Delay is the metric that measures the delay in response time for a specific user action performed for the first time on a website.
How to measure it?
Since FID is a stat measured only by real user interaction, it cannot be replicated in a lab setting.
However, Total Blocking Time (TBT) is a metric that essentially measures how much time a browser is blocked and therefore can closely estimate FID.
To provide a good user experience, sites should strive to have a Total Blocking Time of less than 200 milliseconds when tested on average mobile hardware.
How to find Total Blocking Time (TBT) score of landing page?
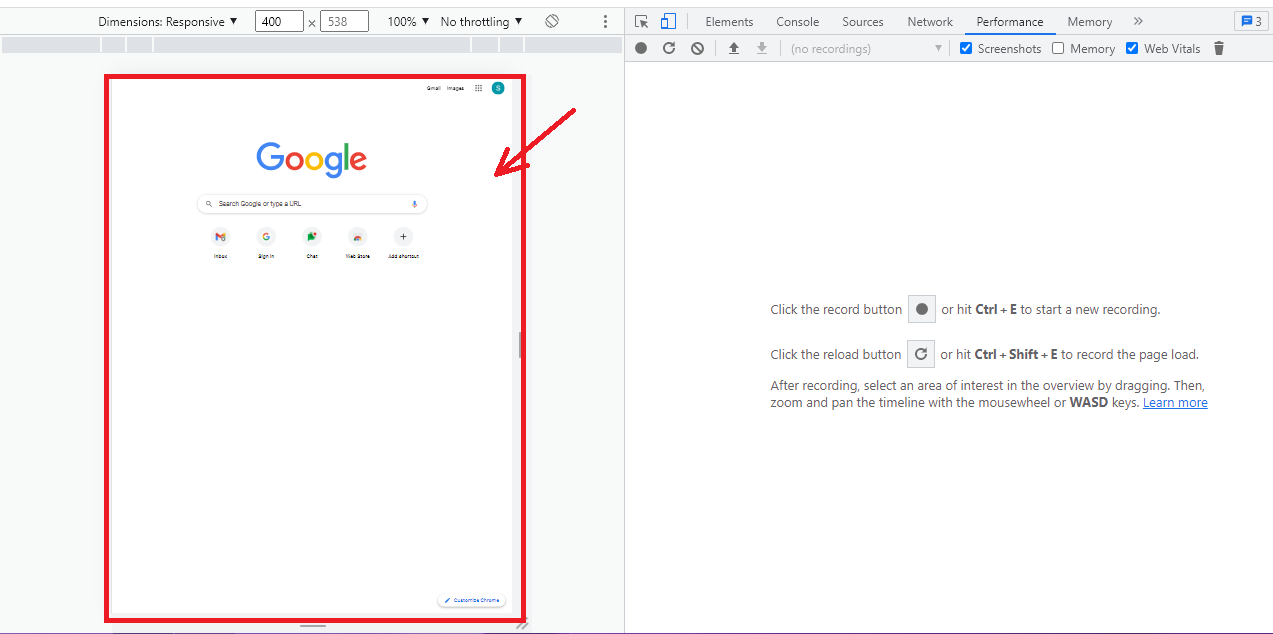
- Press F12 or right click and do "inspect" in chrome browser
- Enter URL

- Go to "Performance" tab and do check "Web Vital" & click the reload button

How TBT is calculated?
For example, consider the following diagram of the browser's main thread during page load:

The above timeline has five tasks, three of which are Long Tasks because their duration exceeds 50 ms. The next diagram shows the blocking time for each of the long tasks:

So while the total time spent running tasks on the main thread is 560 ms, only 345 ms of that time is considered blocking time.
What is a good score?
There is a general understanding that a good score is in less than 100ms.

How to optimize it?
- Reduce JS execution time
Minify and compress your code & Remove unused code.
- Optimize CSS
Minify and compress your CSS & Remove unused code.
- Minimize main thread work
Utilize web workers to do tasks off the main thread & Cut the complexity of your styles and layouts
- Reduce third party code
Third-party JavaScript often refers to scripts that can be embedded into any site directly from a third-party vendor. These scripts can include ads, analytics, widgets and other scripts that make the web more dynamic and interactive.
Ref Video: https://youtu.be/K9eGN0JW1Pg
What is Cumulative Layout Shift (CLS)?
Cumulative Layout Shift (or CLS) is a measure of how much a webpage unexpectedly shifts during its life. For example, if a website visitor loaded a page and, while they were reading it, a banner loads and the page jumps down, that would constitute a large CLS score.
How do you measure Cumulative Layout Shift?
To analyze performance in PageSpeed Insights:
- Enter a website URL into Google's PageSpeed Insights tool.
- Click 'Analyze.'
- Check your performance. You can review both mobile and desktop performance, which you can switch between using the top left corner navigation.
To analyze performance using Lighthouse tools:
- Open up the website you want to analyze in Chrome.
- Navigate to Developer Tools by clicking the three dots in the top right corner of the browser window, choosing “More Tools” and then “Developer Tools.”
- When the console opens, choose “Lighthouse” from the options along the top.
- Click “Generate Report.”
How to analyze Cumulative Layout Shift issue on website?
- Press F12 or right click and do "inspect" in chrome browser
- Enter URL
- Go to "Performance" tab and do check "Web Vital" & click the reload button

- Click on each "Layout Shift" in red to analyse which elements need to be fixed
Whats is a good CLS score?
A good cumulative layout score is anything less than 0.1.

How to optimize it?
- Fonts
Use fonts that are similar to system fonts, Use system fonts to begin with & Self host your fonts
- Image
Optimize your image in JPEG or PNG format, Convert these optimzed images in WEBP format & Specify proper size for images
- Iframe or Embedded Elements
Give your embedded elements proper size to avoid layout shift
- Ads
Allot space for ads and set fallback image in case ads spots don't get fill
How to find current Device Usage report in Google Analytics?
- Open up the Audience tab, and select Mobile and Devices.

Ref Video: https://youtu.be/qKnrQMJC_Iw
Subscribe to:
Posts (Atom)