They directly influence page experience signals, which in turn affect rankings, crawl efficiency, and user retention.
The three metrics are:

How They Affect Rankings
- Direct impact: CWV are part of Google’s Page Experience ranking signals. If two pages have similar relevance, the faster and more stable one ranks higher.
- Indirect impact: Better CWV → lower bounce rate, higher engagement and conversion → positive behavioral signals → stronger SEO over time.
- Crawl efficiency: Fast, stable pages allow Googlebot to crawl more URLs — important for large documentation sites like Stripe’s.
A. Improve LCP (Loading Speed)
- Optimize hero images and SVGs; use WebP/AVIF formats.
- Use server-side rendering (SSR) or static generation for docs pages.
- Implement lazy-loading for below-the-fold assets.
- Use CDNs (Stripe already does globally) to serve content near the user.
- Preload key assets: fonts, CSS, hero images.
- Minimize heavy JavaScript bundles; split code and defer non-critical scripts.
- Use HTTP/2 and caching to reduce latency.
- Audit third-party scripts (analytics, chat widgets) that block input.
- Always set width/height attributes for images and embeds.
- Reserve space for dynamic elements (ads, banners, cookie notices).
- Load fonts using font-display: swap to avoid text shifts.
What is Largest Contentful Paint (LCP)?
Largest Contentful Paint is the metric that measures the time a website takes to show the user the largest content on the screen, complete and ready for interaction.

Google defines that this metric considers only the content above the page’s fold, meaning everything that appears without scrolling.
There is another relevant point, which is related to the type of content considered. The metric only counts the loading time of what is relevant to the user experience, that is:
- Images.
- Image tags.
- Video thumbnails.
- Background images with CSS.
- Text elements, such as paragraphs, headings, and lists.
How to measure it?
You can measure LCP in two ways:
- Directly on the site, by using a method known as “field”.
- Through performance simulations performed by algorithms, in this case, the lab mode.
For each of these methods, different tools speed up the work and make the measurement more accurate. Starting with the field method, you could use:
- Chrome User Experience Report;
- PageSpeed Insights;
- Search Console (Core Web Vitals report).
As for the lab tools, the most recommended are:
- Chrome DevTools.
- Lighthouse.
- WebPageTest.

How to optimize it?
- Optimize image sizes
Always use images with the right sizing. Your hosting will suggest specific dimensions, either for the desktop or mobile version. Using the indicated size avoids overloading, which can generate a high LCP. Use Webp format images.
- Use an image CDN
A CDN service can make images load faster. ImageEngine is a tool that does all the work of image adequacy, considering factors such as accessing device, file size, and user location.
- Avoid JavaScript to load images
JavaScript loading can slow down the process, so the best thing to do is to leave this work to your browser. That helps to prevent any delay, keeping the LCP within the recommended average.
- Choose a good hosting service
Your hosting service also impacts pages’ loading time. Therefore, find a quality one that has a good reputation in the market, and, mainly, that offers an adequate infrastructure for your site’s size and volume of access.
- Minify HTML, CSS & JavaScript
- Enable caching
- Use system font
- Keep DOM small
- Don't keep JavaScript at top or use defer attribute with JavaScript
- Get the devices list from Google Analytics and test according to real device that user are using.
What is First Input Delay (FID)?
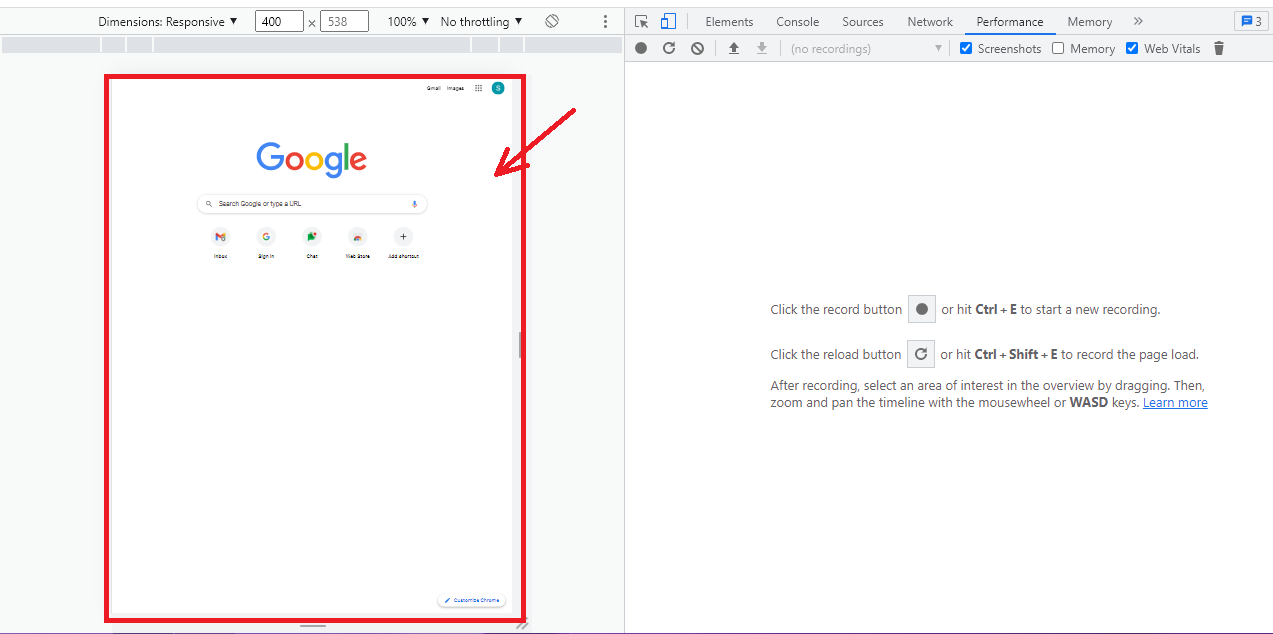
- Press F12 or right click and do "inspect" in chrome browser
- Enter URL

- Go to "Performance" tab and do check "Web Vital" & click the reload button


- Reduce JS execution time
- Optimize CSS
- Minimize main thread work
- Reduce third party code
What is Cumulative Layout Shift (CLS)?
- Enter a website URL into Google's PageSpeed Insights tool.
- Click 'Analyze.'
- Check your performance. You can review both mobile and desktop performance, which you can switch between using the top left corner navigation.
- Open up the website you want to analyze in Chrome.
- Navigate to Developer Tools by clicking the three dots in the top right corner of the browser window, choosing “More Tools” and then “Developer Tools.”
- When the console opens, choose “Lighthouse” from the options along the top.
- Click “Generate Report.”
- Press F12 or right click and do "inspect" in chrome browser
- Enter URL
- Go to "Performance" tab and do check "Web Vital" & click the reload button

- Click on each "Layout Shift" in red to analyse which elements need to be fixed

- Fonts
- Image
- Iframe or Embedded Elements
- Ads
- Open up the Audience tab, and select Mobile and Devices.
